Department of Civil Engineering,Indian Institute of Science, Bangalore
Seismology and geology
Region/Site specific seismic hazard requires study of seismology and geology of region/site. Here we should be clear about Study area (SA) and seismic study area (SSA), SA is location where seismic hazard need to be estimated and SSA is area need to considered for estimating seismic hazard at SA i.e Region or Site. Geology data including geomorphology, water features, faults, lineaments, shear zone and geology changes due to past earthquakes should be complied for the SSA of region/site. Seismic data including earthquake information, seismic recordings, active faults and lineaments associated earthquake are required seismology data to quantify seismic hazard and risk of the region/site. Seismic data can be collected from various international, national and regional agencies operating seismic stations for Global seismic network, regional seismic network and seismic arrays.
Seismic Study Area
A seismic study area of region or site can be identified by considering past Isoseismal map or earthquake damage distribution data in the region. Several seismic hazard related studies carried out, Prof Anbazhagan reveals that 500 km radius around SA for Intraplate /Peninsular India and 750 km radius around SA for Interplate /North India can be considered as seismic study area in India. For other part of world one can establish SSA based on Isoseismal map or earthquake damage distribution data in the country as disscussed in Anbazhagan P, Smitha C V and Abhishek Kumar (2014) "Representative Seismic Hazard Map of Coimbatore, India" Engineering Geology Vol.171, 81-95.Homogenization and Declustering of Seismic Data
Seismic data collected SSA may contain earthquake event in different quantification such as different intensity and magnitude scales depends on period and equipment used to record earthquake. So, it is necessary that the collected seismic data from various sources should be homogenized to common most widely used scale of moment magnitude (Mw) using conversion equations. It should be noted here that there are several conversion equations developed to conversion from one scale to another scale of earthquake measurement. So, one should be more careful about selection of representative conversion equations for the Homogenization. Region specific conversion is highly recommended in the absence of insufficient data conversion equation suitable for the SSA should be considered. Another important step is screen collected seismic data to remove the foreshocks and aftershocks in the combined earthquake catalogue. So, the whole catalogue should be declustered using the time and space window algorithm suitable for the SSA. Importnace of Homogenization and Declustering of Seismic Data and effect of hazard estimation can found in Anbazhagan P and Balakumar A (2019). "Seismic Magnitude Conversion and its Effect on Seismic Hazard Analysis", Journal of Seismology- 23(4), 623-647.Seismotectoic Map
Seismotectonic map is base map showing all Seismotectonic details includes geology, rock type, fault orientation with length, lineaments with lengths, shear zones with length and seismic earthquake events required for seismic hazard and risk studies. Seismotectonic map prepared Geographical Information System (GIS) should provide all necessary information for any advanced studies in future such as regional rupture character and energy based probable source and also updatable easily. Several seismotectonic map was prepared for different seismic microzonation of cities and hazard analysis of important projects. Typical Seismotectonic Map preapration and Map is given below: Seismotectonic details includes geology, rock type, fault orientation with length, lineaments with lengths, shear zones with length and seismic earthquake events. For India, the well defined and documented seismic sources are published in the Seismotectonic Atlas-2000 published by Geological Survey of India. Geological survey of India has compiled all the available geological, geophysical and seismological data for thee entire India and has published a seismotectonic map in 2000. Seismotectonic atlas (SEISAT, 2000) contains 43 maps in 42 sheets of 3ox4o sizes with scale of 1:1 million, which also describes the tectonic frame work and seismicity. SEISAT is prepared with intention that it can be used for the seismic hazard analysis of Indian cities. In this analysis about 6 SEISAT maps are merged, seismic sources with 350km in a circular area having radius around Bangalore are used. Seismicity and activity of the plate tectonic will always change based on neotectonic activity of the region. Thus it is necessary that any seismic hazard should include recent seismicity. An extensive literature has been carried out to collect seismic sources from recent publications. Ganesha Raj and Nijagunappa (2004) have mapped major lineaments of Karnataka State with length more than 100 km using satellite remote sensing data and correlated with the earthquake occurrences. They have highlighted that there are 43 major lineaments and 33 earthquake occurrences with magnitude above 3 (since 1828) in the State. About 23 of these earthquakes were associated with 8 major lineaments, which they have named as active lineaments. The Mandya-Channapatna-Bangalore lineament, Lakshman Thirtha-KRS-Bangalore lineament, and Chelur-Kolar-Battipalle lineament are some of the seismically active lineaments identified by the authors. They have also stated that earthquakes are confined to the southern part of the state indicating that south Karnataka is seismically more active. The authors have also recommended the need to upgrade the seismic zonation map of Karnataka especially for areas surrounding Mandya, Bangalore, and Kolar. Karnataka lineaments published by Ganesha Raj and Nijagunappa (2004) using remote sensing data are also considered in the present study.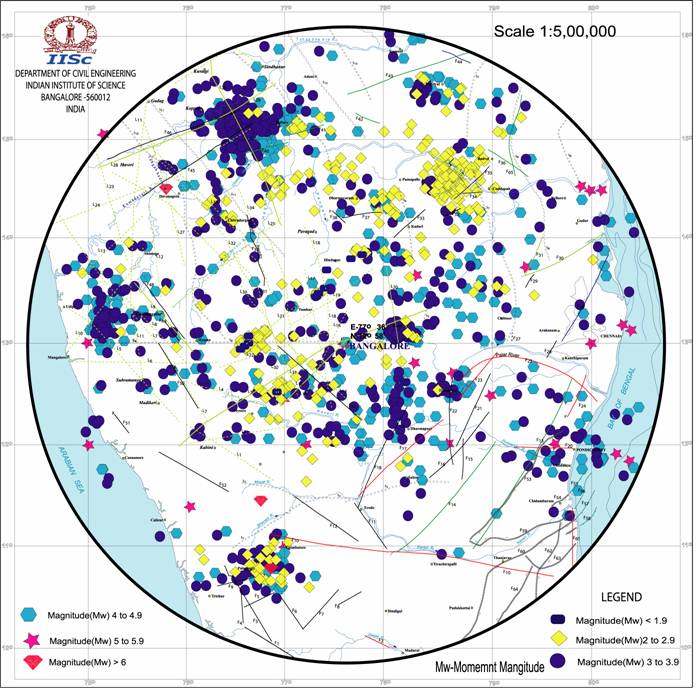
To contact
| Phone: | +91-080-22932467 |
| Cell: | +91-9448100410 |
| Fax: | +91-080-23600404 |
| Email: | anbazhagan@iisc.ac.in , anbazhagan2005@gmail.com |